
ZH / Science
Every aircraft is a measuring instrument.
We hold the work to the standard of peer-reviewed field science.
001 / Three rules
- Every output carries its uncertainty.
- Every method is checked against ground truth.
- Results are reported, good or bad.

002 / What comes with every result
| Output | What comes with it |
|---|---|
| Methane readings | The detection limit and the conditions, including wind, flight height and speed |
| Change flags | A confidence score and the imagery behind it |
| Maps and elevation models | A stated accuracy, checked against independent survey points |
| Detection models | Monthly precision and recall with confidence intervals, on data the models haven't seen |
003 / Why an aircraft that lives on site
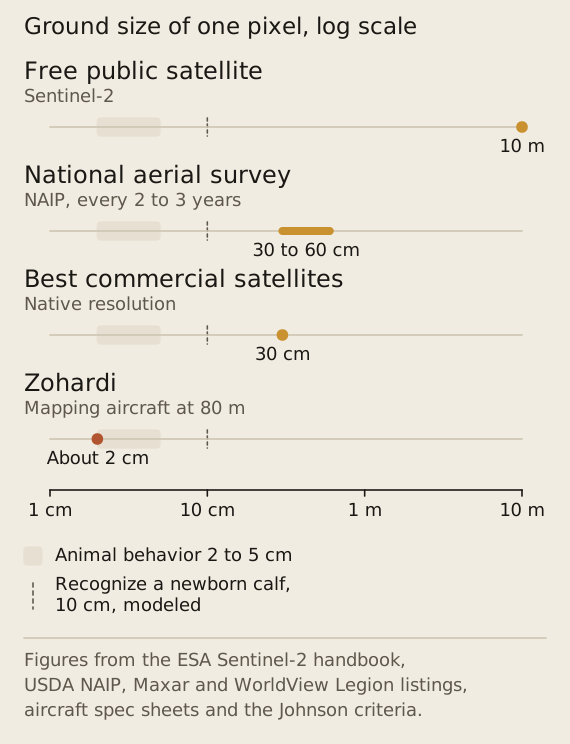
- Resolution. The best commercial satellites stop at about 30 cm per pixel. An aircraft at 80 m resolves about 2 cm with an ordinary camera.
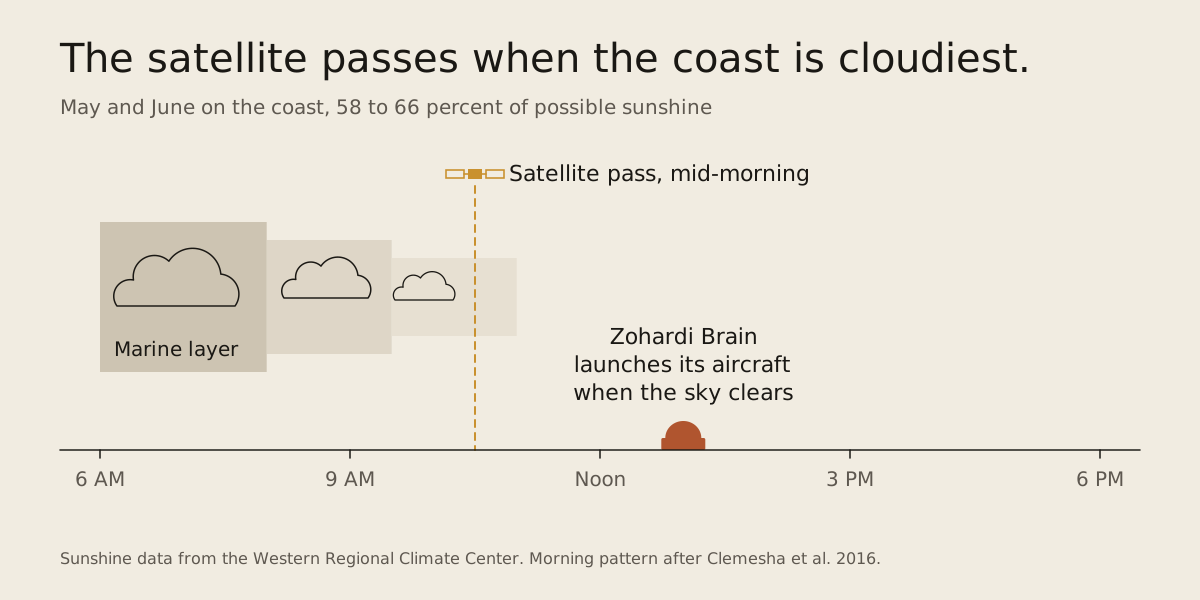
- Timing. Imaging satellites pass mid-morning, when the coastal marine layer peaks, and coastal weather stations log only 58 to 66 percent of possible sunshine in May and June. A Zohardi Brain flies its aircraft under the cloud deck and reschedules by the hour.
- Sampling. Pasture, moisture and fuel vary over tens of meters. Point sensors can calibrate a field, but they can't map it.
- The baseline. Each season of a property's own history makes smaller changes detectable. A newcomer starts from zero on every acre.
004 / Methods
How a flight becomes a measurement.
The first weeks on a property are a calibration campaign.
- Mapping and accuracy. Photogrammetry stitches each flight's overlapping photos into a map about 2 cm per pixel. Accuracy, how close each point sits to where it really is, comes from corrected satellite positioning (RTK) and is checked against survey points on the property, so every map states its measured accuracy. Flying the same property from the same dock lines each map up with the last, so a change on the map is a change on the ground.
- Photogrammetry or Gaussian splatting. Anything we measure, such as maps, elevation and volumes, comes from photogrammetry. Gaussian splatting builds lifelike 3D views for seeing a structure or a stand of trees from every angle, and we don't measure from it.
- Multispectral. Multispectral cameras record how plants reflect visible and near-infrared light, including red edge. Every image is corrected to true reflectance with the day's sunlight readings and reference targets on site, so a greener field means a greener field, not a sunnier day. From that come standard vegetation indices such as NDVI and NDRE, which track plant vigor and stress, standing feed, fuel dryness and crop health.
- Thermal. Radiometric thermal cameras record a temperature for every pixel, not just a picture of heat, corrected with the weather readings taken on site. Thermal finds livestock and wildlife, leaks and wet ground, crops running warm under water stress, and hot spots in landfill covers. It reads surfaces, not what lies beneath them.
- Weather at the dock. Every Zohardi Brain has its own weather station, recording wind, rain, temperature, humidity, sunlight and lightning around the clock. That record decides when it's safe to fly, corrects the readings from each flight and builds a microclimate history of the property itself.
- Read together. Each sensor sees one side of the ground. Our models read imagery, reflectance, temperature and gas together with the dock's weather record, so one kind of evidence can confirm or rule out another, and a dry week or a cold dawn isn't mistaken for real change. That combination, more than any single sensor, is what makes our findings reliable.
005 / Our own models
General models struggle with imagery from above.
The best vision-language model scored 41.7 percent on the GEOBench-VLM geospatial benchmark (ICCV 2025), so we train our own models for imagery from above.
Maxar and WorldView Legion resolution listings; WRCC percent of possible sunshine; Clemesha et al. 2016; GEOBench-VLM (Danish et al., ICCV 2025). The full list is in the whitepaper.